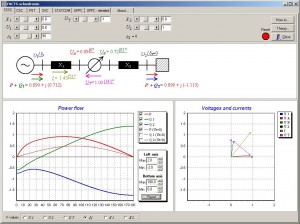
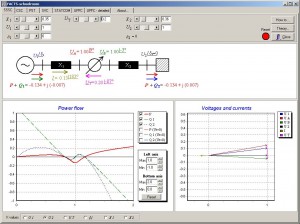
The impact of FACTS (Flexible AC Transmission System) devices on a power-system operation depends on many parameters. Consequently, it is difficult to keep representations of this impacts simple enough and most important explanatory. This was the motivation for developing a software that enables graphical representation of current and voltage phasors as well as active and reactive powers in longitudinal power system, containing different FACTS devices. Changes in graphical representation of phasor diagram can be monitored for variation of all FACTS and power-system parameters.
FACTS schoolroom also offers numeric values of mentioned variables. This is why it can be useful for creating a fast estimate of credibility of more complex calculations.


